Population Summary
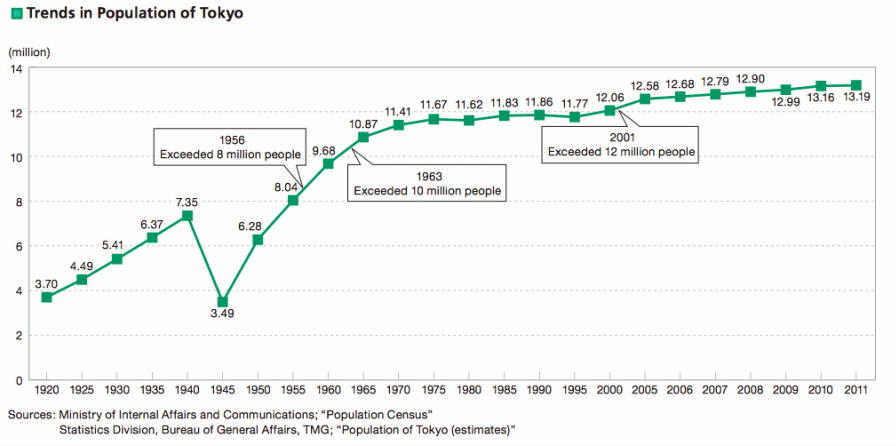
As of October 1, 2011, the population of Tokyo is estimated to be 13.189 million, or about 10% of Japan's total population, and it has the largest population among all the 47 prefectures.
At 2,188 square kilometres, the area of Tokyo is 0.6% of the total area of Japan. With a population density of 6,029 persons per square kilometre, Tokyo is the most densely populated prefecture in Japan. The ward area is home to 8.97 million persons, the Tama area, 4.191 million, and the Islands, 28,000.
Tokyo has 6.447 million households, with an average 2.05 persons per household. The number of registered foreign residents is 408,000 as of October 1, 2011, some 1.2 times more than the total figure 10 years earlier.
Population Change
The population migration between Tokyo and other prefectures in 2010 showed a total migration of 744,000 persons with 396,000 persons moving into Tokyo while 348,000 persons moved out, for a net social increase of 48,000 persons.
With the exception of 1985, there was a prevailing trend of out-migration exceeding in-migration since 1967, until a net social increase was seen for the first time in 12 years in 1997. 2010 again showed a net increase.
Looking at the migration between Tokyo and the three adjacent prefectures (Saitama, Chiba, and Kanagawa prefectures), 183,000 people came into Tokyo while 186,000 moved out, constituting 49.5% of the total population migration.
During the year 2010 there were 109,000 births and 104,000 deaths, for a net natural increase of 4,000. This increase, however, has been declining since the peak 182,000 in 1968.
Demographic Composition by Age
According to the National Census, as of October 1, 2010, the population of Tokyo was 13.159 million (according to the Statistics Bureau, Ministry of Internal Affairs and Communications).
This number was divided into three age categories:
Child population (ages 0 – 14) at 1.477 million that is 11.4%
Working-age population (ages 15 – 64) at 8.85 million that is 68.2%
Aged population (ages 65 and over) at 2.642 million that is 20.4% of the overall population.
The percentage of aged persons exceeded the United Nations standard of 14% for an “aged society” in 1998, and is now approaching the level of 21%, signifying a “super-aged society.”
Labor Force Population
As of October 1, 2005, the population aged 15 years and older was 10.991 million persons, of whom 5.916 million were employed and 354,000 fully unemployed within a total labor force population of 6.27 million persons.
Demographic Composition by Industry
According to the National Census of 2005, when employed persons were viewed by the three industrial groups:
26,000 persons (0.4%) were employed in the primary industry of agriculture, forestry, and fisheries;
1.109 million (18.7%) in the secondary in- dustry of mining, construction, and manufacturing;
4.576 million (77.4%) in the tertiary industry of commerce, transportation, communication, and services.
Demographic Composition by Occupation
According to the National Census of 2005, when employed persons were viewed by the four employment groups:
28,000 persons (0.5%) were employed in agriculture, forestry, and fisheries;
1.343 million (22.7%) in manufacturing and transportation related occupations;
1.718 million (29.0%) in sales and services;
2.632 million (44.5%) in clerical, technical, and management occupations.
Daytime and Nighttime Population
The National Census in 2005 lists the daytime population of Tokyo as 14.978 million people, which is 2.562 million more than the nighttime population figure of 12.416 million. This makes the daytime population 1.2 times more than that of the nighttime population; the daytime population index is 120.6 against the nighttime population taken at 100. This difference is caused by the population of commuting workers and students, constituting a daytime influx from mainly the three neighbouring prefectures of Saitama, Chiba, and Kanagawa.
Changes in the metropolis since 1965 show that in the period up to 2005, while the night-time population increased by 1.55 million (14.2%), the day-time population had a much greater increase of 3.23 million (27.5%), bringing about a large imbalance.
